Dashboard
Table of contents
Dashboard
Dashboard
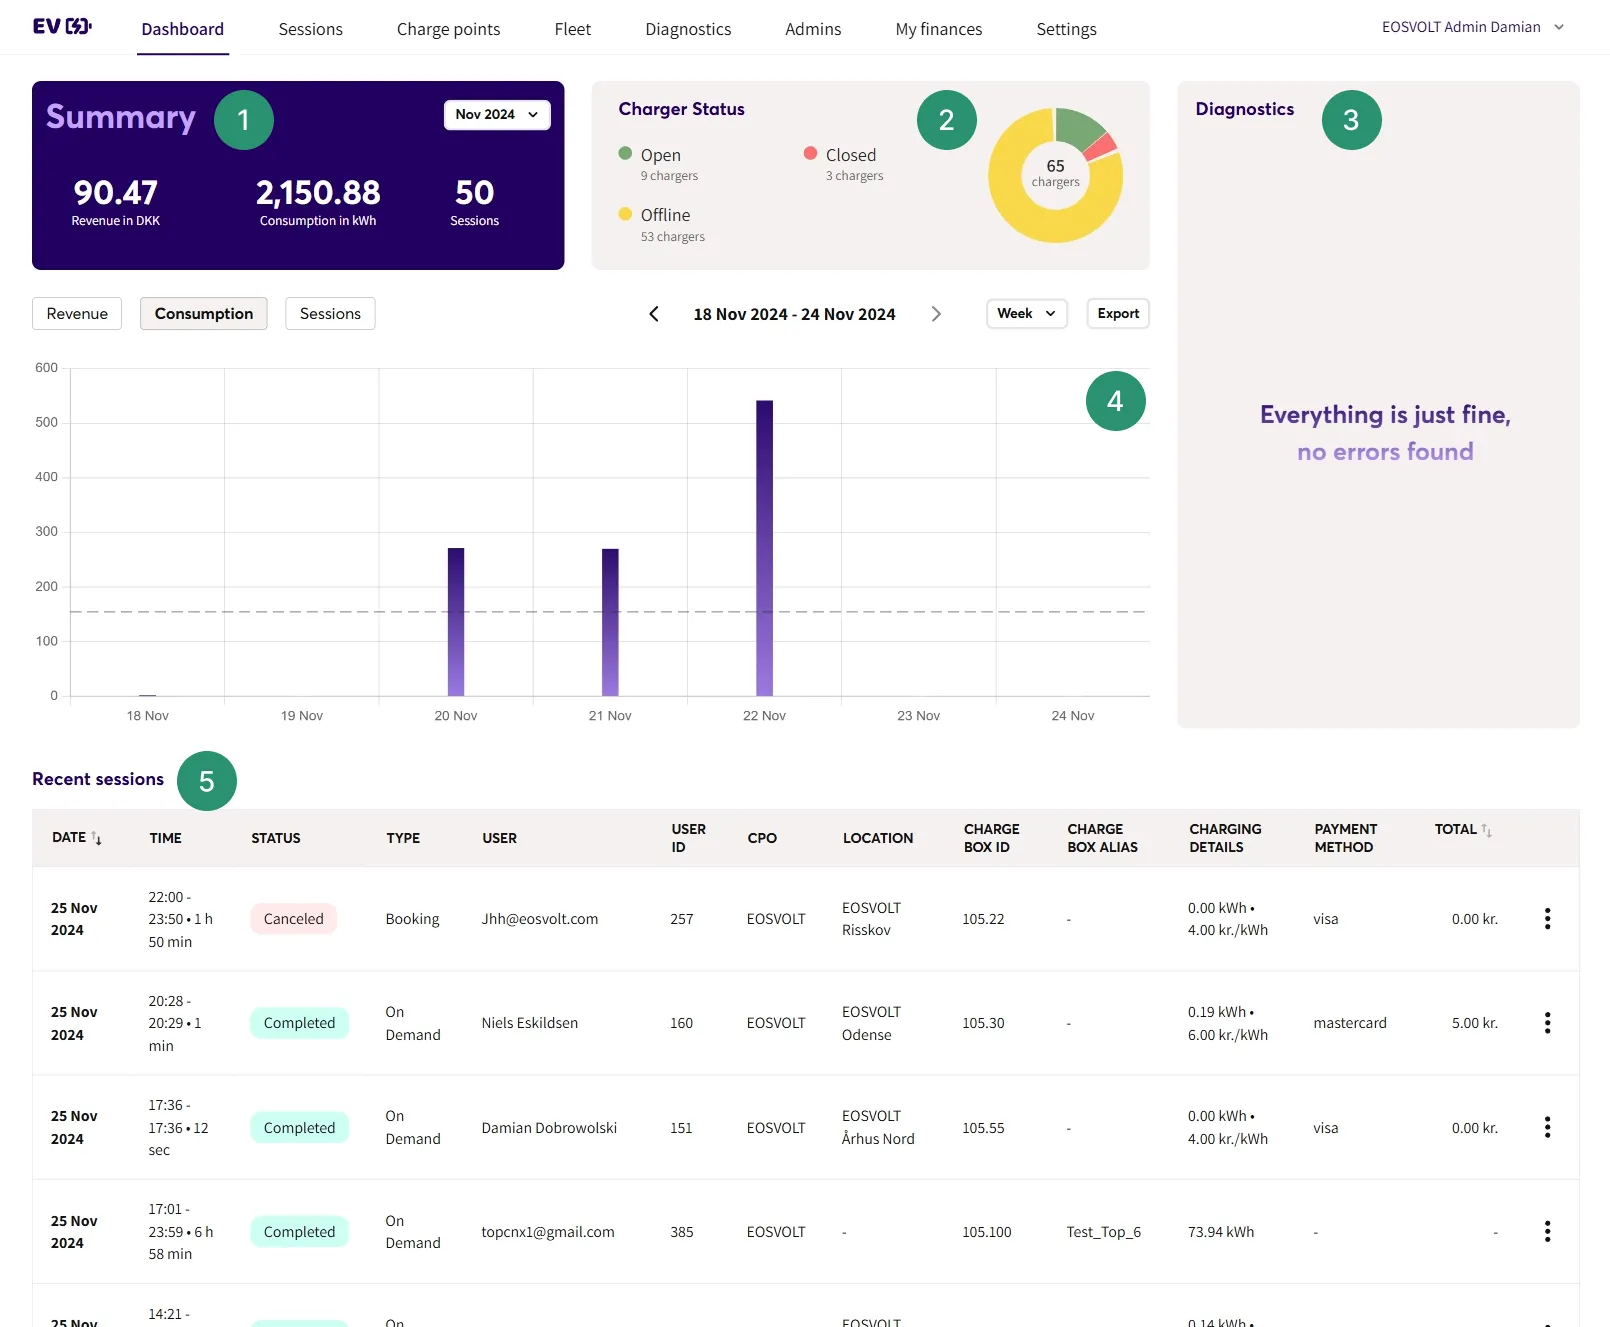
Our dashboard is divided into five main areas:
- Summary
This section provides a monthly summary of your revenue, consumption, and session count.- You can specify by time frames whether by day, month, or year, using the available dropdown menu.
- Charger Status
Here, you can get an overview of your chargers' statuses; whether they're online, offline, charging, or in need of diagnostics/support. - Diagnostics
This section offers quick notifications if any issues arise.- Chargers that report errors will be displayed here. This allows you to identify and resolve problems quickly.
- Graph
This section provides a visual representation of your performance.- You can view revenue, consumption, and session counts in graph form, with the option to select a timeframe (week, month, or year).
- Additionally, you can export the displayed data in XLSX format using the export button.
- Recent Sessions
A quick overview of the latest ten sessions appears here.- You can also access detailed session insights and download session logs from this tab.
Table of contents
Dashboard